Page 12 - RSC Aqualia 2017
P. 12

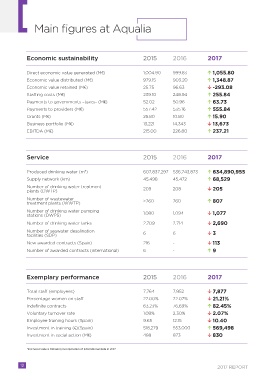
Main figures at Aqualia


             Economic sustainability                             2015         2016           2017


             Direct economic value generated (M€)                1,004.90     999.83            1,055.80
             Economic value distributed (M€)                     979.15       903.20            1,348.87
             Economic value retained (M€)                        25.75        96.63             -293.08
             Staffing costs (M€)                                 239.10       248.94            255.84
             Payments to governments –taxes- (M€)                52.02        50.96             63.73
             Payments to providers (M€)                          557.42       535.16            555.84
             Grants (M€)                                         25.80        10.80             15.90
             Business portfolio (M€)                             13,221       14,343            13,673
             EBITDA (M€)                                         215.00       226.80            237.21


             Service                                             2015         2016           2017


             Produced drinking water (m )                        607,837,297  536,743,873       634,890,955
                                       3
             Supply network (km)                                 45,498       45,472            68,529
             Number of drinking water treatment                  209          208               205
             plants (DWTP)
             Number of wastewater                                >760         760               807
             treatment plants (WWTP)
             Number of drinking water pumping                    1,080        1,094             1,077
             stations (DWPS)
             Number of drinking water tanks                      2,709        2,714             2,690
             Number of seawater desalination                     6            6
             facilities (SDP)                                                                   3

             New awarded contracts (Spain)                       216          -                 113
             Number of awarded contracts (international)         6            -                 9


             Exemplary performance                               2015         2016           2017


             Total staff (employees)                             7,764        7,952             7,877
             Percentage women on staff                           22.00%       22.07%            21.21%
             Indefinite contracts                                63.23%       76.69%            82.45%
             Voluntary turnover rate                             1.08%        2.30%             2.07%
             Employee training hours (Spain)                     9.65         12.15             10.40
             Investment in training (€)(Spain)                   518,279      553,000           569,498
             Investment in social action (M€)                    488          873               830


             *Increased values following incorporation of international data in 2017


          12
                                                                                                  2017 REPORT
   7   8   9   10   11   12   13   14   15   16   17