Page 9 - Aqualia MRSC 2015
P. 9

G4-4, G4-8, G4-9, G4-EC1, G4-EC4, G4-EC7 09

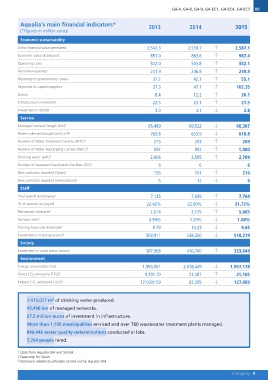
 Aqualia's main financial indicators*             2013          2014         2015

 (*Figures in million euros)                          2,542.3     2,559.7       2,587.1
 Economic sustainability                                851.0        863.6        987.4
                                                        512.0        503.8        552.1
Direct financial value generated                        241.9        246.8        249.9
Economic value distributed                               37.2         42.3          55.1
Operating costs                                          37.3         47.1
Personnel expenses                                         8.4        12.2      102.35
Payments to governments -taxes-                          22.5         23.1          26.1
Payments to capital suppliers                              3.0         3.1          27.5
Grants                                                                               2.8
Infrastructure investment                              65,489      69,522
Investment in R&D&I                                     763.8        653.9      66,387
                                                                                  618.8
 Service                                                  215          203          209
Managed network length (km)1                              892          892        1,080
Water collected-bought (mill. m3)1                      2,606        2,595        2,709
Number of Water Treatment Centres (WTC)1                                                6
Number of Water Repumping Centres (WRC)1                     6            6         216
Drinking water tanks1                                     155          151              6
Number of Seawater Desalination facilities (SDF)                        12
New contracts awarded (Spain)                                5                    7,764
New contracts awarded (International)                                7,639     21.72%
                                                        7,125     22.80%
 Staff                                                22.42%                      5,065
Total payroll (employees)                                            2,175       1.08%
% of women on payroll                                   2,014       1.29%
Permanent contracts2                                   0.94%         10.23          9.65
Turnover rate2                                                    538,250      518,279
Training hours per employee2                             9.79
Investment in training (euros)2                      503,911      416,700      333,649

 Society                                             387,968    2,018,449    1,957,178
Investment in social action (euros)                                21,487       21,165
                                                   1,955,051       82,335
 Environment                                        9,191.70                   127,683
Energy consumption (GJ)                           127,601.50
Direct CO2 emissions (TEQ)3
Indirect CO2 emissions (TEQ)3

      7,475,077 m3 of drinking water produced.
      45,498 km of managed networks.
      27.5 million euros of investment in infrastructure.
      More than 1,100 municipalities serviced and over 760 wastewater treatment plants managed.
      840,446 water quality determinations conducted in labs.
      7,764 people hired.

1 Data from Aqualia GIA and SmVak
2 Data only for Spain
3 Emissions related to activities carried out by Aqualia GIA

                                                                                                                                                                Company 9
   4   5   6   7   8   9   10   11   12   13   14